



























Variability in osmolality analytical methodology and reporting underscores the need for standardization and clinician awareness to enable meaningful comparisons across enteral nutrition formulas.
A study comparing osmolality of common peptide-based enteral formulas using vapor pressure osmometry, a standard analytical methodology, identified differences compared to published values.
What is Osmolality?
- Osmolality is the concentration of free particles in solution, reported as mOsm/kg H2O
- Macro- and micronutrients, including fruit and vegetable ingredients, as well as the size (i.e., smaller size) of particles, contribute to enteral nutrition osmolality
If considering osmolality in enteral nutrition formula selection, clinicians should be aware of variability in analytical testing and reporting practices that may limit meaningful comparisons of osmolality across formulas and manufacturers.
While some differences in osmolality may be expected due to analytical variability, formula homogeneity, storage conditions, and changes over shelf life, larger magnitude variability may lie outside anticipated discrepancies.
Poster Summary
Apples to Osmoles? Differences in Osmolality Reporting for Enteral Formulas and Implications for Clinical Practice
Blackmer A, Huhmann MB, Klosterbuer A
A Research Summary based on Poster#P53 at ASPEN26 Nutrition Science and Practice Conference, February 14-17, 2026, Long Beach, California.
J Parenter Enteral Nutr. 2026; 50: S71-S332.
Why was this study done?
Osmolality is the concentration of free particles in solution 1,2
Reported enteral nutrition (EN) formula osmolality is typically 280–875 mOsm/kg H2O
Despite common perception, there’s little evidence to suggest that higher EN osmolality alone causes gastrointestinal (GI) intolerance/ diarrhea 1,3,4
Yet, clinicians often use osmolality as a factor when choosing EN, particularly for patients transitioning to peptide formulas with previous intolerance to standard EN
Thus, variability in analytical methodologies and reporting practices may limit clinical utility of osmolality comparisons
This study aimed to compare osmolality of common pediatric and adult EN peptide-based formulas using standard methodologies 5–8 to assess variability across formulas with different ingredients, caloric densities, and manufacturers.
How was this study performed?
Nine commercially available pediatric and adult plant-based peptide-based (PBP) formulas were identified:
FV-PBP: including fruit and vegetable ingredients (Compleat® Peptide formulas, Nestlé Healthcare Nutrition, US); n=4
W-PBP: without fruit and vegetable ingredients (Kate Farms® Peptide formulas, Kate Farms Inc, US); n=5Measured osmolality was determined using vapor pressure osmometry (Vapro® Vapor Pressure Osmometer, Wescor Model 5600), which is recommended for products with osmolality 100–3,000 mOsm/kg H2O or increased viscosity and has been adopted as an industry standard for medical foods internationally 5–8
Samples were tested in triplicate, with averages compared to osmolality values published on manufacturer websites
Based on prior reporting 8, additional samples diluted 1:1 with 200 mOsm/kg H2O NaCl solution were measured to assess impact of dilution
Post-Hoc Secondary Analysis
A secondary analysis was performed using the same methodology as described to evaluate non-plant-based peptide formulas (N‑PBP) (Abbott Nutrition; Vital® 1.5 and Vital® HP 1.0)
Study Results
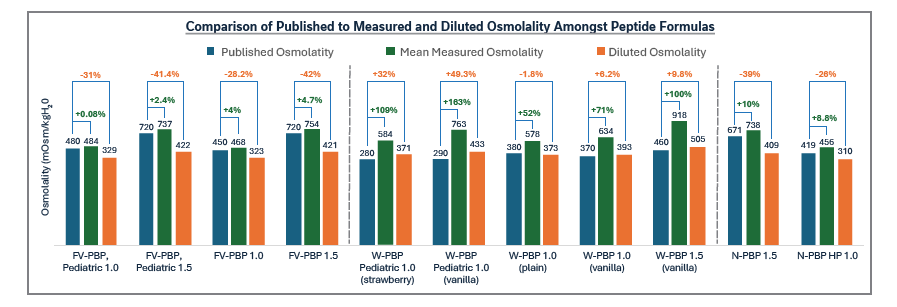
For FV-PBP, measured osmolality was 0.08–2.4% higher and 4–4.7% higher for pediatric and adult formulas, respectively
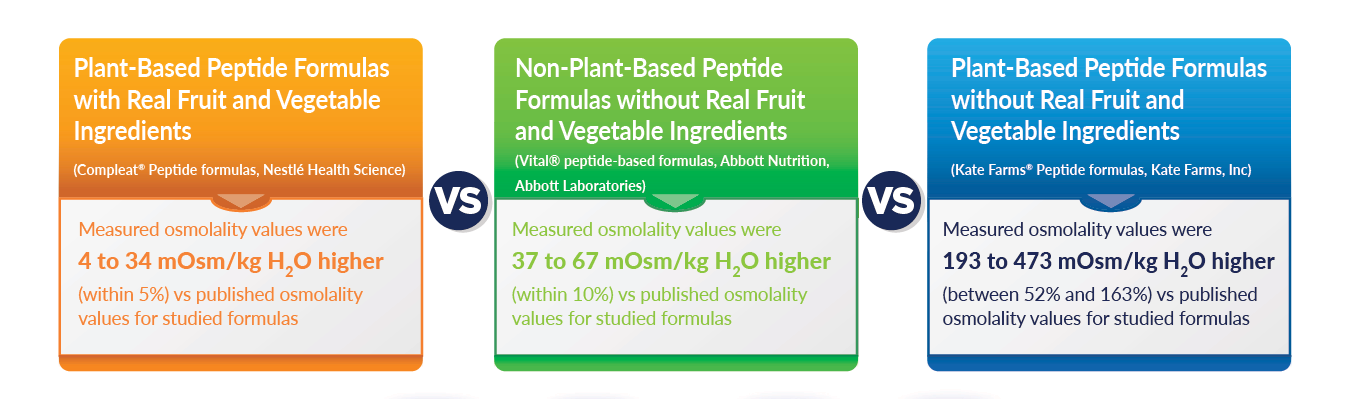
For W-PBP, measured osmolality was 109–163% higher and 52–100% higher for pediatric and adult formulas, respectively
For N-PBP, measured osmolality was 8.8–10% higher than published osmolality
Use of diluted samples increased variability for FV-PBP and N-PBP but decreased variability for W-PBP
Differences in measured versus published osmolality were greater for products with higher caloric density
Discussion and Future Results
Notable differences were observed for W-PBP, with measured osmolality more than two times higher than published values in three of five samples.
Although minor discrepancies may be expected due to analytical variability, formula homogeneity, storage conditions, and shelf-life changes, differences of 200–400 mOsm/kg H2O would not be anticipated; dilution did not fully explain the differences.For FV-PBP, measured osmolality compared to published osmolality was within 5% of all formulas, suggesting good agreement.
Future research may focus on expanding analysis to additional EN formulas.
Conclusions
This analysis underscores the need for standardized methodology and reporting practices to enable meaningful comparisons of osmolality across EN formulas. Clinicians should remain aware of differences when considering osmolality as part of formula selection.
References:
1) Roberts S, Kirsh R. Enteral nutrition formulations. In The ASPEN Adult Nutrition Support Core Curriculum. American Society for Parenteral and Enteral Nutrition 2017.
2) Sadowska A, et al. Molecules. 2021 Sep 15;26(18):5607.
3) Barrett JS, et al. JPEN 2009;33(1):21-26.
4) Edes TE, et al. Am J of Med. 1990;88(91): 91-93.
5) Sweeney TE and Beuchat CA. Am J Physiol. 1993;264: R469-R480.
6) National Health Commission of the People’s Republic of China; State Administration for Market Regulation. GB 5009.301.2025. National Food Safety Standard – Determination of Osmotic Pressure in Food.
7) Adams ET Jr, et al. Methods Enzymol. 1978;48:69-154.
8) Cassady B, et al. JAND 2023; 123(10): A-25.
Helpful Links:
To review the poster presented at ASPEN 2026, click here
To access the full publication and additional Compleat® studies, visit: www.nestlemedicalhub.com/compleatevidence
Interested in learning more about Compleat® Publications? Click here to access list of other Compleat® publications.
All trademarks are owned by Société des Produits Nestlé S.A., Vevey, Switzerland. ©2026 Nestlé.
USE UNDER MEDICAL SUPERVISION.